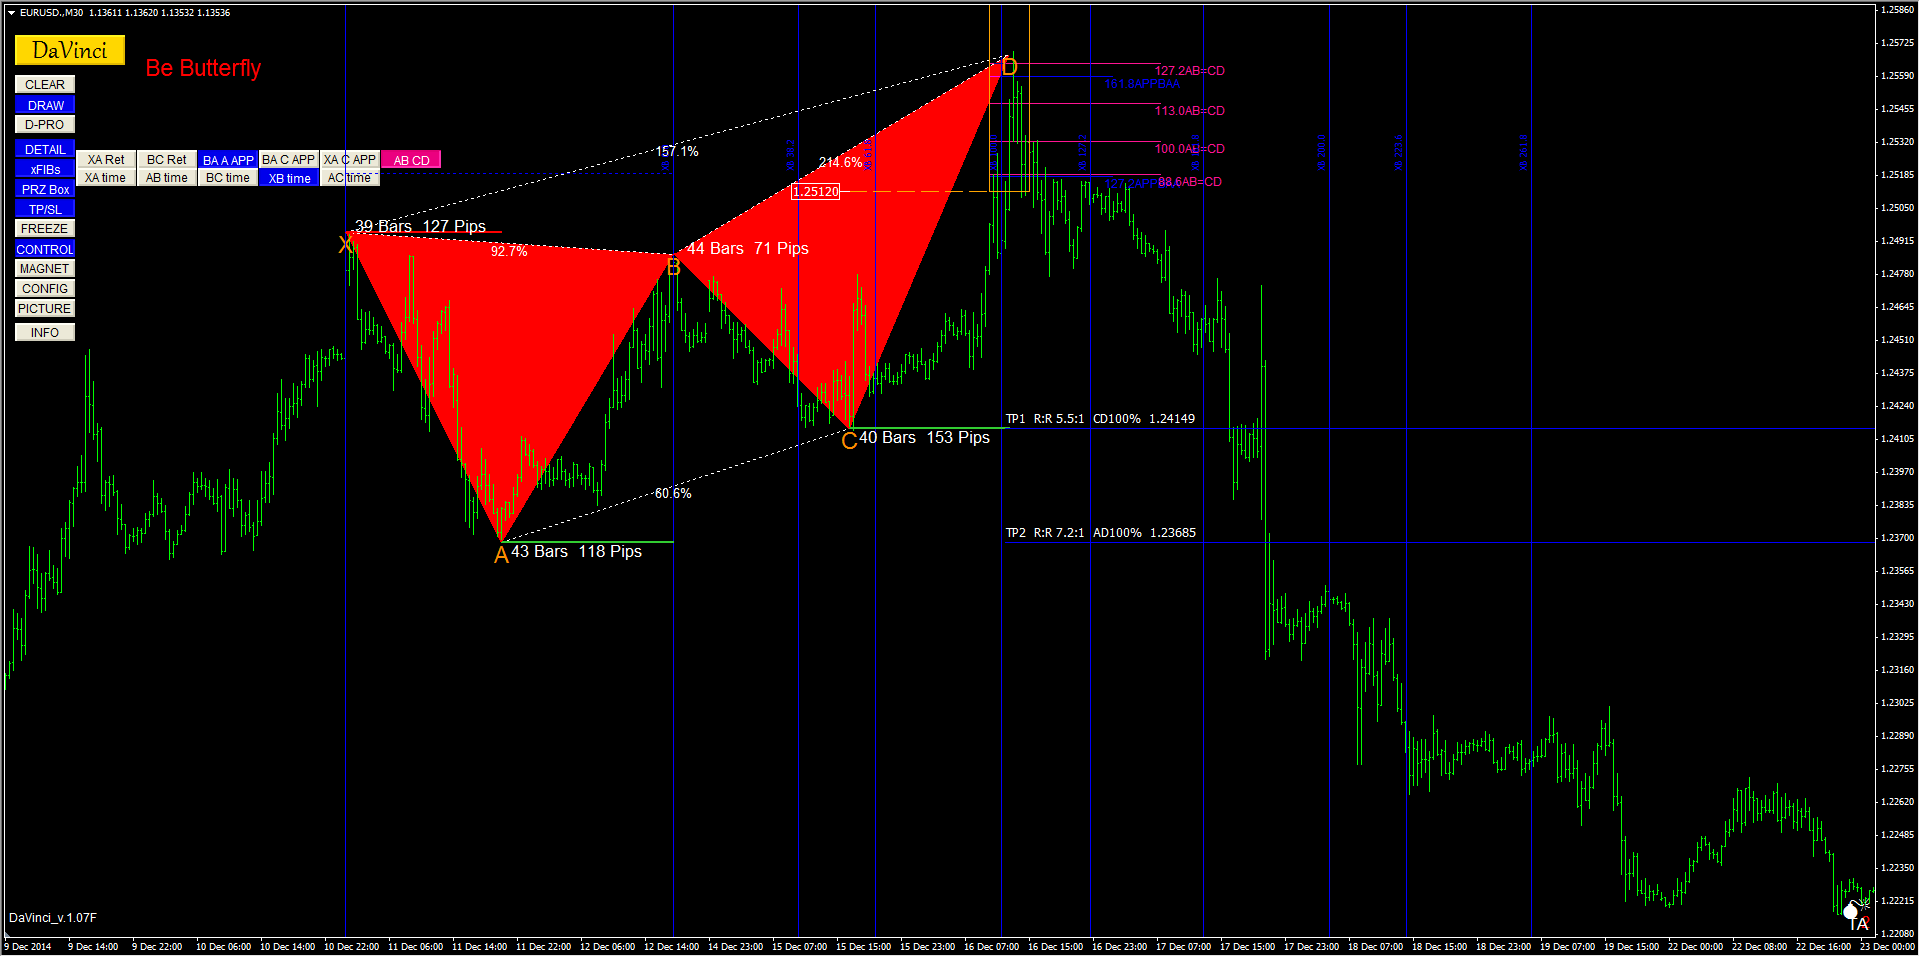
Please write in couple of sentences what is the exact criteria for you to enter a harmonic trade?
Since you are a junior HT trader how about decreasing the number of FX pairs you monitor? In trading, less is more.
A very Good Sunday to all of you.. I have spending sometime here to do some charting to predict tomorrow's price movement. As per Kor recommendation, I will write down all the criteria for my trade entry. Basically this time round, I am purely doing price forecasting basing on Elliot Wave and ABCD Pattern (As seen in attached pic). I will further elaborate more on this.. Hope to hear some comments from the rest of you in order to improve my Trading Skill. =). Currently I am looking at 3 Pairs now, the rest of the 2 pairs will be post up later..
EURJPY 5M Chart
Firstly, I will try to figure out is there any "Impulse or Corrective Wave". Base on the Pic, I manage to found an Impulse Downtrend Wave, in order to make sure that the Impulse Wave is a "Valid" Wave, I have made a quick check by using Fibo Ratio. Below I will list down my Fibo Criteria for each of the wave.
Wave 2 = 50.0 or 61.8 of Wave 1 (Which is XO in pic)
Wave 3 = 161.8 of Wave 1 (XO)
Wave 3 (Extended Version) = 261.8 and 425 of Wave 1 (XO)
Wave 4 = 23.6, 38.2 and 50.0 of Wave 3 (AB)
Wave 5 = If Wave 3 > 161.8 of Wave 1 (XO), therefore Wave 5 = 161.8 of Wave 1 & 261.8 of Wave 1 (XO)
Wave 5 = If Wave 3 < 161.8 of Wave 1 (XO), therefore Wave 5 = 61.8 of Wave 3 & 161.8 of Wave 3 (AB)
Basing on my Chart above, all the ratio are matches well with the requirement set above (of course not at the exact fibo, nearby to it =)
Once this is done, I will further confirm my entry by using ABCD pattern,
Wave from A to D is the ABCD pattern which I am gonna use to check for the entry, base on the chart above, I am entering my trade @ 127.2 of AB, SL @ 168.5 of AB. I will enter 2 Trades, which one goes to TP1 (Which located at Point B of ABCD Pattern). While my second trade will go for TP2 (Which located at 68.5 of AD)
Hope to hear more from the rest of you as in I am still new in Harmonic Trading.. Thx & Cheers!
Yeoh
P/S: Hey Guys, I missed out the "O" Point in the image.. But i believe you guys should know where it is... =P Really sorry bout it...
Last edited by Yeoh Ting Hee; 10-28-2012 at 02:04 PM.
As promise in the afternoon, hereby I will attached a pic which showing USDCHF Pair. =)
USDCHF 15M Chart
In this pair, I also able to look for a completed Impulse Wave, but this Wave Pattern is kinda different from the one i posted earlier, the Wave 3 Seems to in extended fibo ratio, which exceed 261.8 Level. I try to google around, and manage to find some info which related to this. While for the Wave 5, I estimate basing on the 161.8 and 261.8 of XO (Which is the height of Wave 1). Buy judging on the Fibo ratio, this 5 Waves sounds Valid to me.. So in this case, I take it as the Completion of Wave 5 and its heading to Corrective Wave now. Look at the Chart again (Thick Yellow Line), presuming Wave A and Wave B and been successfully formed, now should be the time waiting for CD to complete. Estimate D point will be somewhere around 127.2 and 161.8 of AB.
With the help of Elliot Wave, it can assist me in identifying the next trend movement and further assist in identifying potential Gartley or ABCD Pattern. ( I only trade Gartley and ABCD as of now... ) =)
Hope to hear some comments / feedback from all of you to further refine my trading technique / method.. =)
My last currency Pair, AUDUSD, This Image will be kinda messy, as in the chart itself contained a Completed Impulse Wave, a Completed Corrective Wave. And now I am presumming that it is heading uptrend with a new Impulse 5 Wave. Looking at the Chart, Wave 1 to Wave 4 is completed. Now Waiting to form Wave 5. The rectangle box is the estimate area where Wave 5 will end.. If it really ends up as a Complete Impulse Wave, there is a chance to take Wave 3, 4 and 5 as ABCD Pattern to identify trade to enter and aim for Corrective Wave B (Subject to the matching of ABCD Fibo Ratio before entering any trade.)
Again sorry for such a messy picture, am still new to this so need to have all this fibo lines to guide me.. =)
AUDUSD 15M Chart
Cheers! Good Night Everyone =)... Its Midnight 1am here in Singapore.. =)
if you like elliot wave analysis i recommend 'dynamic trading' by robert miner, but to be honest i think you seek elliot waves too hard, you cannot predict every price change with this analysis