Trading Arsenal Tools

1 licence = 1 MT4 account, one time fee, updates free
sent via email within 24 hours
DaVinci
DaVinci
Support the harmonic trader’s analysis and make the drawing of valid harmonic patterns, using the MetaTrader platform, as simple as possible; removing the need for manual calculations, drawing lots of Fibonacci measurements (retracement/projection/extension levels) and referencing of notes to check the rules. The user positions the X, A, B, C, D points on the chart and the indicator will perform the validation and classification of the harmonic pattern, draw the PRZ BOX and Fibonacci PRZ lines.
Learn more about DaVinci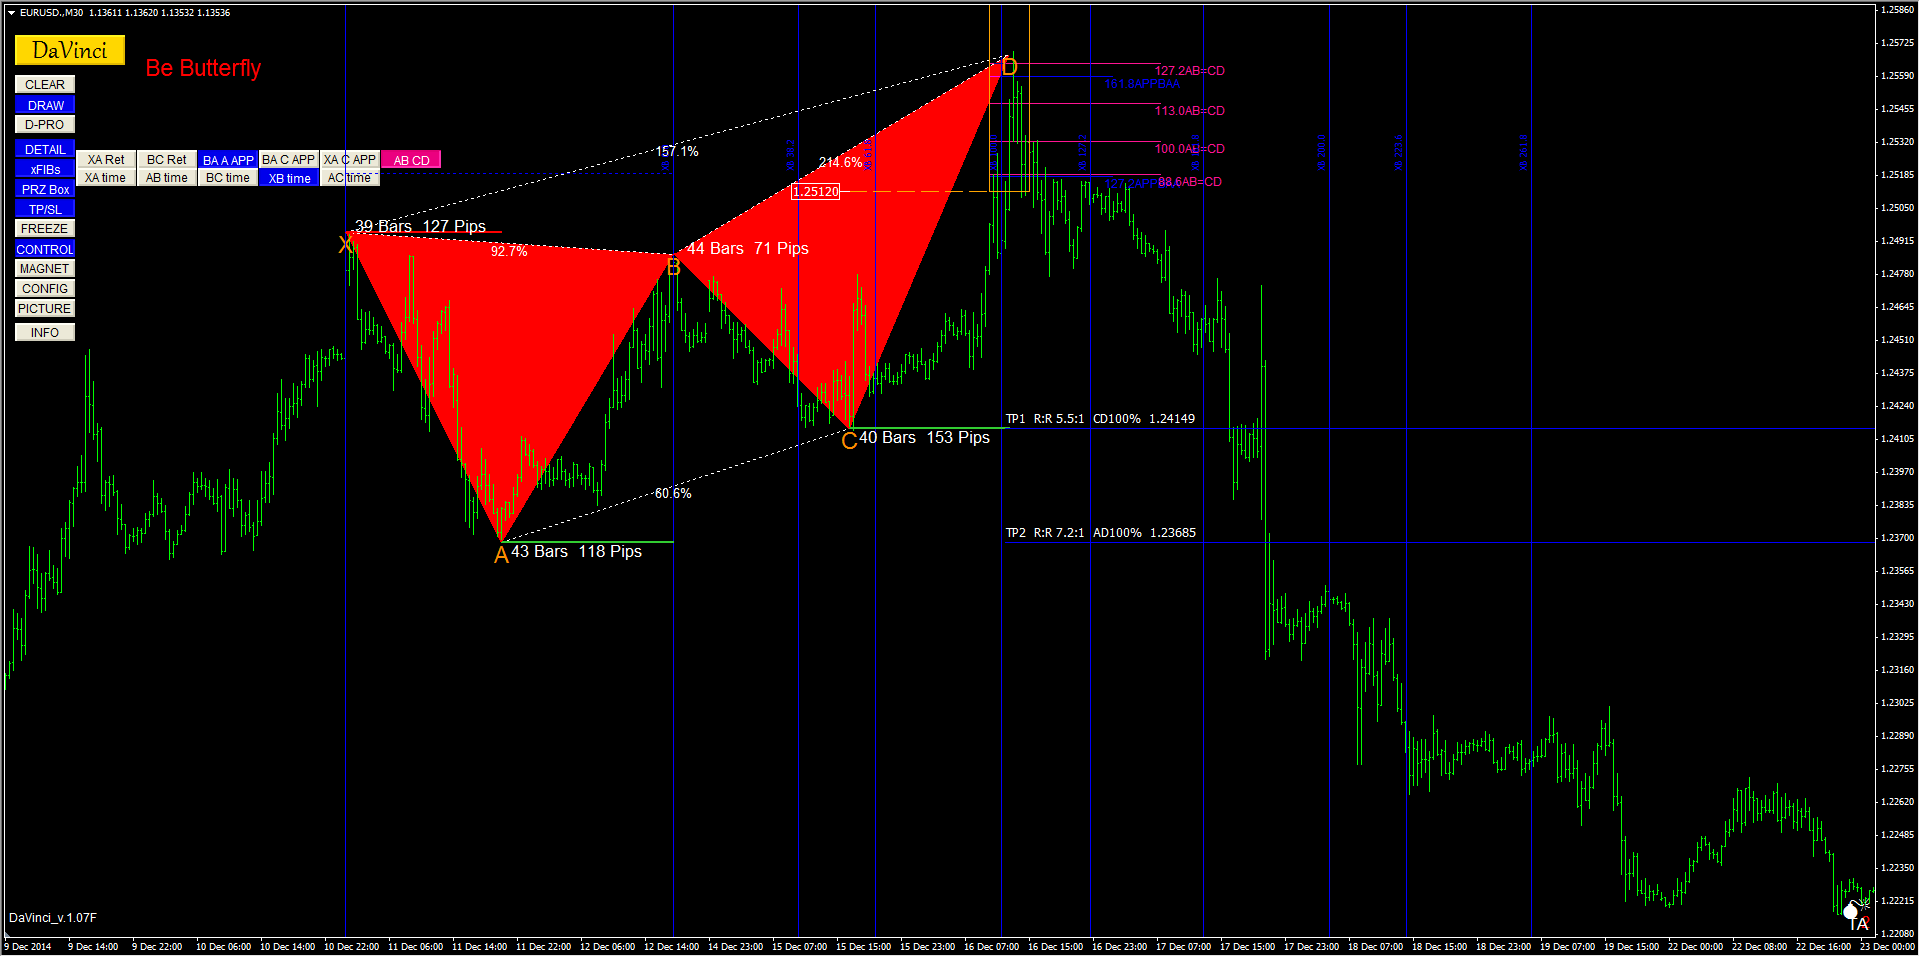
FiboManager
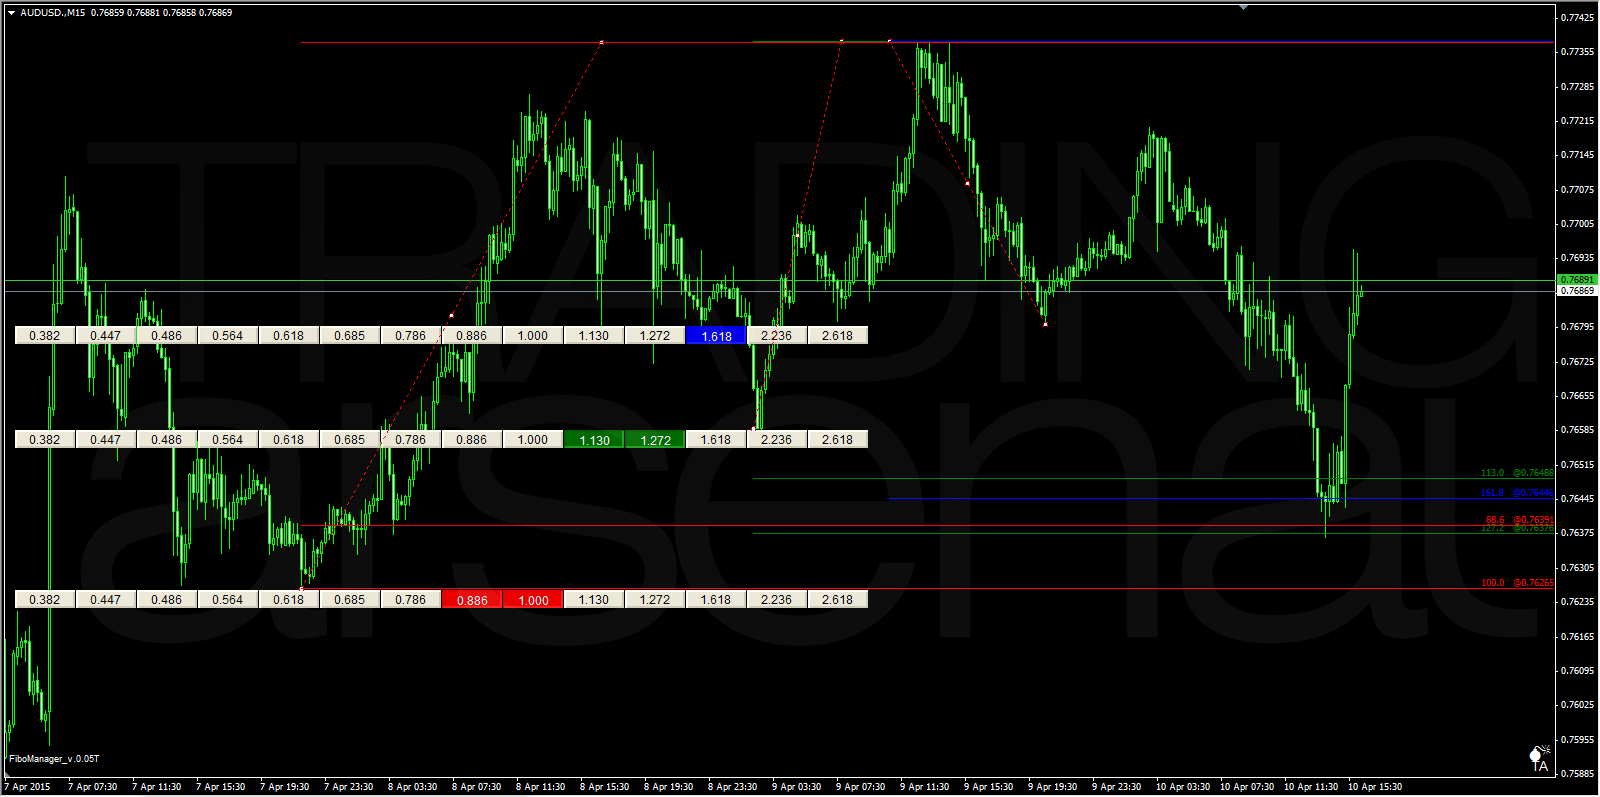
FiboManager
FiboManager is an MT4 extension tool that supports Fibonacci price and time analysis and Fibonacci based trading.
Learn more about FiboManagerMTF cycle
MTF cycle
Time based confirmation to fine tune trade entry. MTF Cycle indicator performs mutli-timeframe analysis to automatically detect market cycles.
Learn more about MTF cycle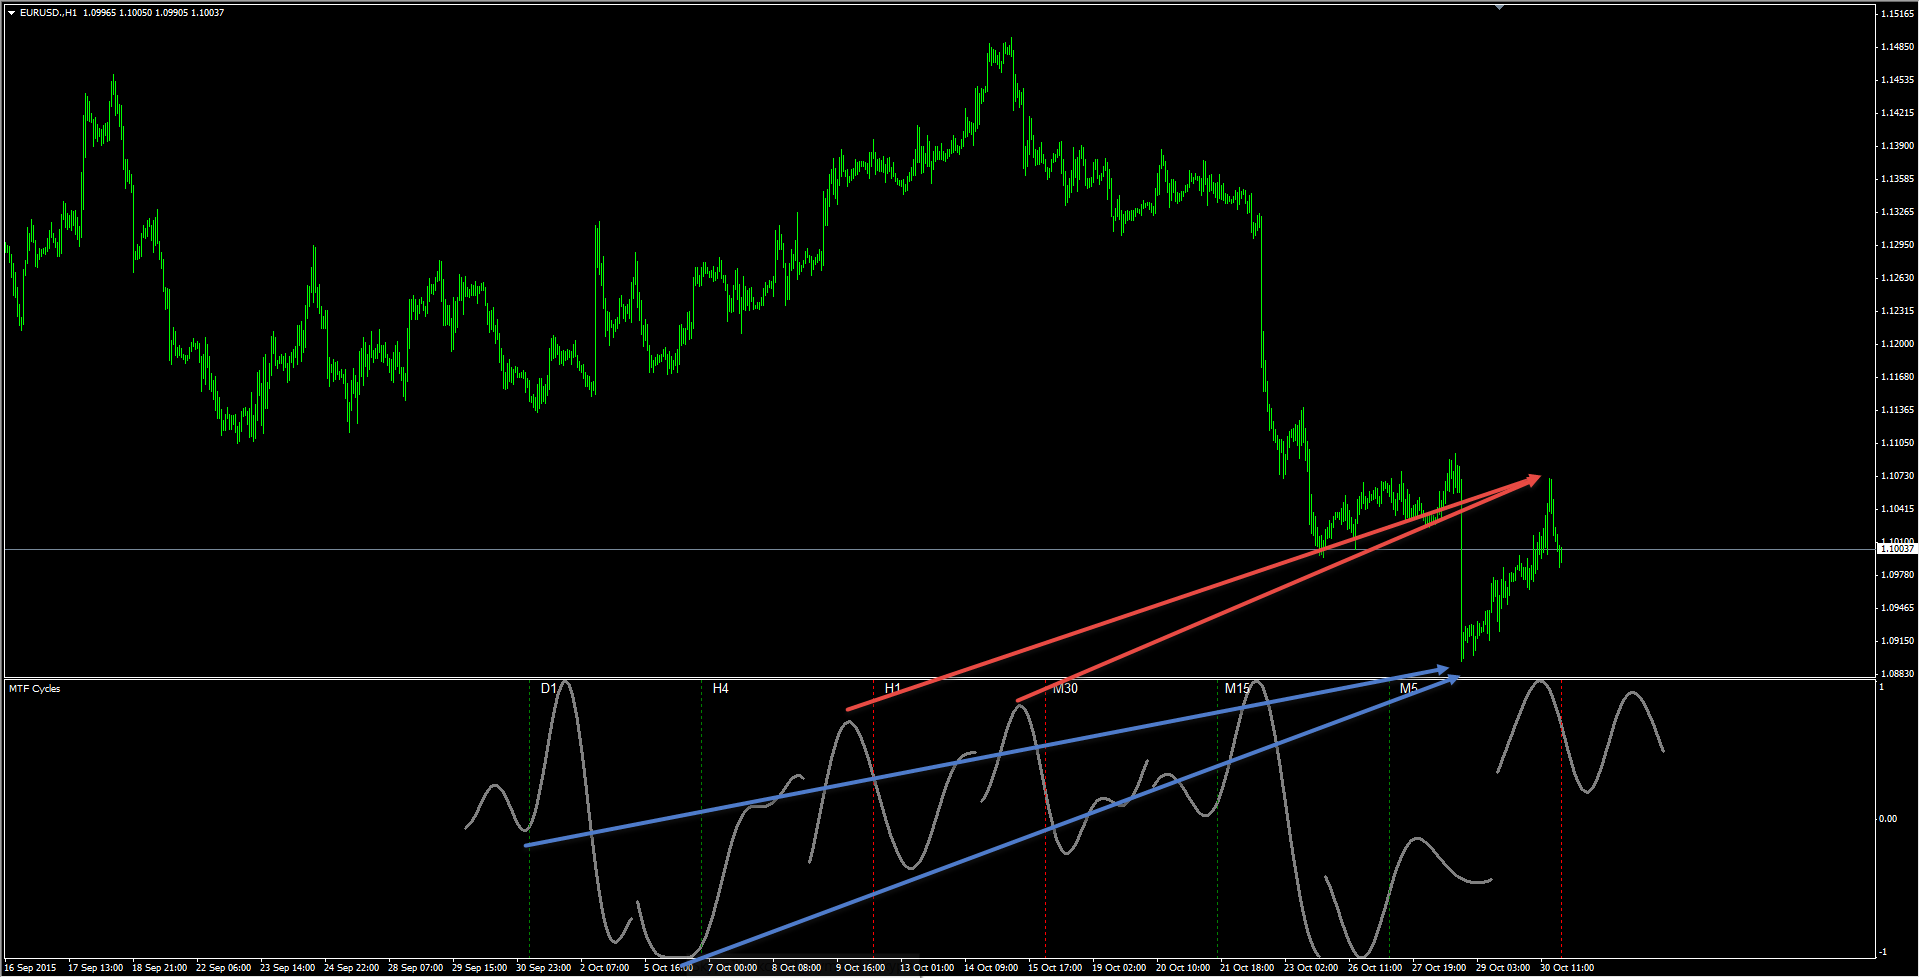
ZoneAlert
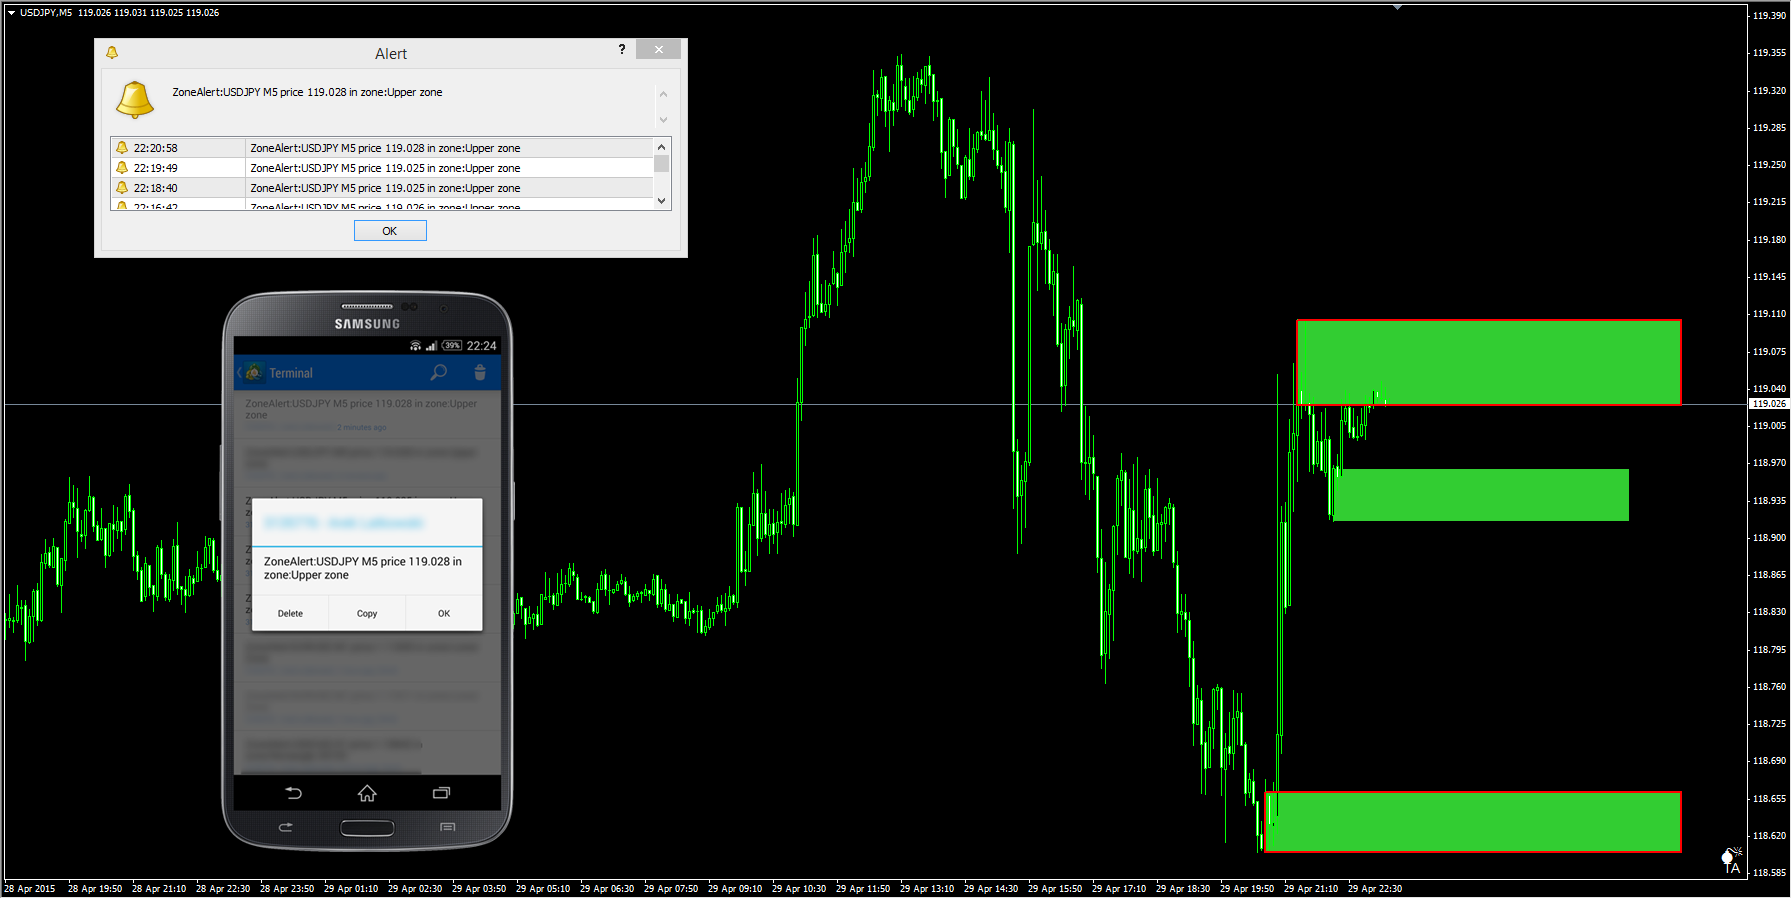
ZoneAlert
ZoneAlert is used to define zones (rectangles) on the chart, so when price reaches the zone an MT4 Alert and/or Mobile (iOS/Android) notification is generated.
Learn more about ZoneAlertkorHarmonics
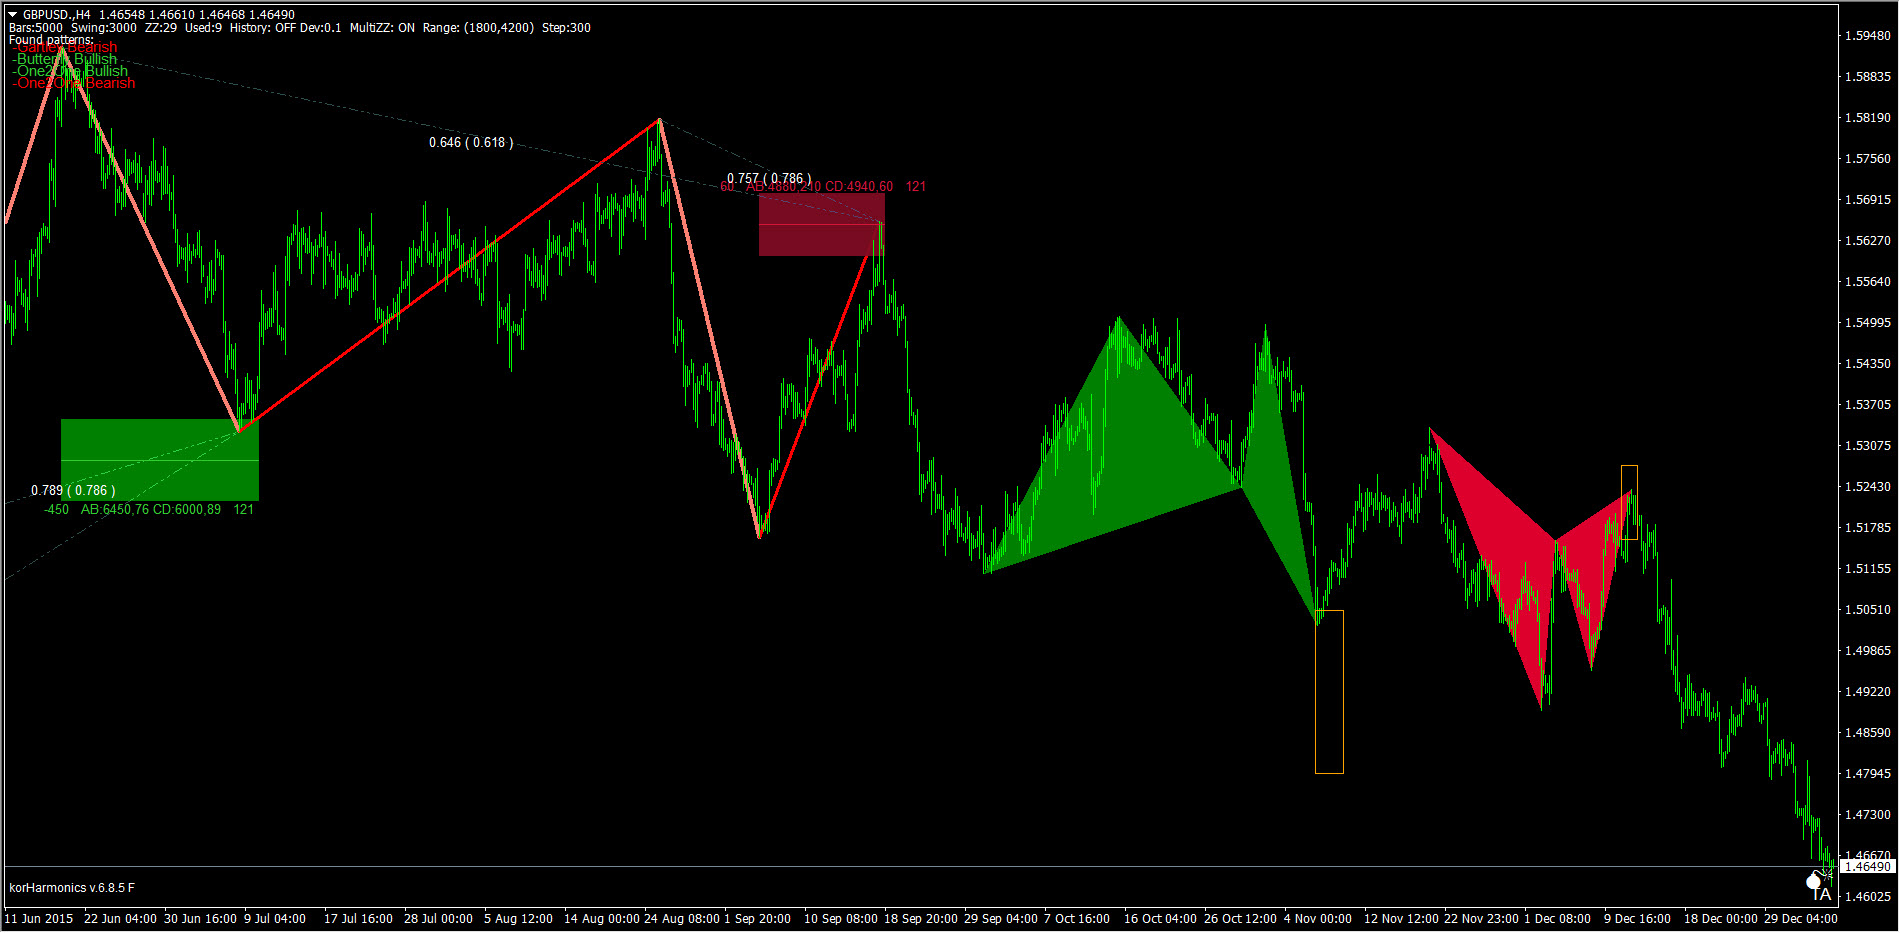
korHarmonics
korHarmonics – the most popular and complete harmonic and price pattern indicator for Metatrader. It automatically scans your charts for various price and geometric patterns. Monitors multiple markets, instruments and timeframe. Assures that proper patterns are spotted and user alerted on time.
Learn more about korHarmonics