567Likes -
09-17-2012, 02:35 AM #811
[Weekly prognosis

Candle open: bullish outside and above, t05 w21ema, 1.3066
ADX: above 30 and flat = bullish
OSMA: Bullish
Stochastics: Bullish and over 80
UTF Stochs: bullish and wider KD lines gap compared to last week
Chart pattern: macro is downtrend line, medium is down channel now broken, micro up move
Moving averages: 200 flat price below, 50 flat price above, 21 2'oclock angle price above = slightly bullish
volume: bullish
Bias is Bullish upmove w/in the macro down trending pattern
Weekly Action plan/ chunk.
if w50 mr2 holds as support, trade up to mr3 m21ema cluster.
if 1.3066 holds as support, trade up to mr3 m21ema cluster envelope(env).
if mr3 m21ema cluster and envelope breaks and tests as new support, trade up to down tl 1,3463 env2 cluster.
if *down tl 1,3463 env2 cluster breaks and tests as new support, trade up to 1.4141
if 1.3066 breaks and tests as new resistance, trade down to w50ma mr2 cluster.
if w50ma mr2 cluster breaks and tests as new resistance, trade down to *mr1 w21ma cluster
if mr1 w21ma cluster breaks and tests as new resistance, trade down to mpp
Key Levels
Support
apr 24 low 1.3066
w50 mr2 - 1.2991 - 1.2953
w21 mr1 - 1.2706 - 65
mpp - 1.2449
ms1 - 1.2261
m200ma, july low- 1.2051 1.2041
Resistance *
env m21ema mr3 - 1.3185 - 1.3235 - 1.3268
feb high tl w200ma- 1.3408 - 63 - 1.3539
oct 2011 high - 1.4148
Daily Prognosis

Candle open: inside open above t05 21ema 314.16 fib env. = bullish
ADX: - > 30 rising = bullish trending
OSMA: bullish with prior top break
Stochastics: bear cross but above 80 might cross down - Caution
UTF Stokes: above 80 slightly bullish constant kd narrow gap.
Chart pattern: bullish
Moving averages: 200 21 50. 21 200 flat price above, 21 1 o'clock price above, 50 1-2 0'clock price above overall bullish picture
Volume: Bullish
Bias is bullish.
Daily Action plan/ chunk.
if 314.16 holds as support, trade up to wr1 361.8 mr3 upper mid envelope(env) cluster
if wr1 361.8 mr3 upper mid envelope(env) cluster breaks & tests as new support, trade up to wr2 tl 423.6 cluster
if wpp tl holds as support, trade up to wr1 361.8 mr3 upper mid envelope(env) cluster
if mr2 261.8 holds as support, trade up to 314.16 reevaluate then continue to wr1 361.8 mr3 upper mid envelope(env) cluster
if 314.16 breaks and tests as new resistance, trade down to tl 2618 cluster being aware that wpp is on the way.
if tl 2618 cluster breaks and tests as new resistance, trade down to 224.0 tl d200ma ws1 cluster
if 224.0 tl d200ma ws1 cluster breaks and tests as new resistance, trade down to wd21ema cluster being aware that the 200 mr1 might be on the way.
if wd21ema cluster breaks and tests as new resistance, complete the channel @ the 161.8 tl cluster.
Key Levels
Support
314.16 - 1.3100/05
wpp tl *1.3017
mr2 2618 - 1.2940 - 52
d200ma ws1 224.0 tl - 1.2800-60
200 mr1 - 1.2752-65
wd21emas - 1.2722 - 1.2700
1618 tl - 1.2634
Le Resistance *
3618 wr1 mr3 1.3253-79
wr2 tl - 1.3430
423.6 env feb hi - 1.3444-63
w200ma - 1.3539
wr3 - 1.3692- 1.3700
-
09-17-2012, 02:36 AM #812
[Weekly prognosis

Candle open: bullish outside and above mr2, t05 w21eme, open = bullish
ADX: above 30 and rising = bullish
OSMA: Bullish
Stochastics: Bullish and over 80
UTF Stochs: bullish and wider KD lines gap compared to last week
Chart pattern: macro is box type range, medium is triangle range now broken, micro uptrend line
Moving averages: Bullish COMA Correct Order Moving Average with 21, 50, 200 w/1-2 o'clock angle
Bias is Bullish w/in a ranging macro pattern. *
Weekly Action plan/ chunk.
as long 161.8 holds as support, bias remains the upside.
if 161.8 holds as support, up to 200. if 200 breaks and tests, then up to 224.mr2
if 224, mr2 breaks and tests as support, trade up to 261.8, mo200sma cluster. *
if mr2 holds as support up to 200.
if mr2 breaks and tests as resistance, temporary down to 161.8
if 161.8 breaks and tests as resistance, trade down to 118.0 w21 m21ema cluster being aware of the mo 21 ema in between,
if 118.0 w21 cluster breaks and tests trade down to 0.0,50sma mpp cluster. if this cluster breaks then trade down to bottom of triangle pattern is open.
Key Levels
Support
161.8, dTL - 1.6090
mr2 - 1.6020
w21ema 118.0 1.5835 - 1.5867
0.0, tl, 50ma, mpp - 1.5777/76
TL 78.6 - 1.5376
Resistance *
200.0 previous pivot high - 1.6273-85
224.0 mr3 - 1.6407-43
2.618 200sma - 1.6600-48
Daily Prognosis

Candle open: outside bullish open above the mr2 fib, tl break, t05 and 21ema = bullish overall
ADX: - > 30 rising = bullish trending
OSMA: bullish
Stochastics: bullish above 80 might cross down - Caution
UTF Stokes: slightly bullish constant kd gap.
Chart pattern: bullish
Moving averages: COMA correct order moving averages 21 50 200. 21 1 o'clock price above, 50 2-3 o'clock price above, 200 3 o'clock price above, overall bullish picture
Volume: Bullish
Bias is bullish.
Daily Action plan/ chunk.
if 200 holds as resistance, trade down to wpp being aware that mr2 is on the way.
if 161.8 tl, cluster breaks and tests, trade down to ws1 mr1 tl *cluster
if ws1 mr1 tl cluster breaks and tests as resistance, trade down to d21 127 cluster.
if d21 127 cluster breaks and tests as resistance, trade down to 118.o ws2 w21ema cluster.
if 118.o ws2 w21ema cluster breaks and tests as resistance, *trade down to 0.0 mpp wtl cluster.
if mr2, wpp or 161.8 tl holds as support trade up to 200.0 prior pivot high cluster
if 200.0 prior pivot high cluster breaks and tests as new support, trade up to 224.0 wr1 mr3 cluster
if 224.0 wr1 mr3 cluster reaks and tests as new support, trade up to 261.8 wr3 cluster.
Key Levels
Support
161.8, dTL - 1.6090
wpp - 1.6143
mr2 - 1.6020
ws1 tl mr1 - 1,6020-30
w21ema 118.0 1.5835 - 1.5867
0.0, tl, 50ma, mpp - 1.5777/76
Le Resistance *
200.0 previous pivot high wr1 - 1.6273-85 1.6327
224.0 wr1, mr3 - 1.6407-43
2.618 200sma wr3 - 1.6600-48 1.6623
-
09-17-2012, 02:37 AM #813 Weekly prognosis

Candle open: bearish outside and below lower trend line but above 261.8 fib
ADX: above 30 and rising = bearish
OSMA: Bearish.
Stochastics: slightly bullish but under 20= iffy
UTF Stochs: kd wider compared to last week bearish mode.
Chart pattern: macro bearish triangle is broken, macro bearish range, mid down channel, micro bearish move
Moving averages: Bearish COMA Correct Order Moving Averages with 21, 50, 200 21 & 50 4-5o'clock 200 3-4 o'clock angle bearish
Bias is Bearish w/in a larger ranging macro pattern. *
Weekly Action plan/ chunk.
if 261.8 holds as support then trade up to 224.0/ 200.0
if 200.0 breaks and tests as support, trade up to 161.8 mpp, w21 cluster, if break and test then up to 138.2 1.0 parity level
if tl holds as resistance, 261.8 breaks and tests as resistance, trade down to 314.16, ms3 cluster
if 314.16 ms3 breaks then trade down to 361,8 and macro range bottom.
Key Levels
Support
314.16, ms3 0.9537 - 0.9530
361.8, prior range low - 0.9412
Resistance *
261.8 ms2, tl - 0.9685 - 0.9674
224.0 ms1 - 0.9772 - 0.9774
200.0 - 0.9836
161.8, mpp - 0.9928 - 0.9937
138.2 mr1 parity level- 1.0015 - 0.9998 1.0000
Daily Prognosis

Candle open: inside open after kangaroo tail doji, below wpp and out of t05.
ADX: > 30 rising = * favors bearishness
OSMA: bearish
Stochastics: bullish
UTF Stokes: bullish below 20
Chart pattern: bearish
Moving averages: COMA correct order moving averages = 21, 50 3-4 o'clock 50, 200 3 o'clock price is below all 3 = *bearish
Volume: dropped on the kangaroo tail candle looks ct-ish
Bias is: slightly bearish with the possibility of range to counter trend.
Daily Action plan/ chunk.
if 261.8 holds as support a temporary up movet to wpp may be expected
if wpp holds as resistance, trade down to 261.8 reevaluate, if 261.8/ lower weekly tl breaks and tests then continue down wr1. if wr1 breaks and tests then down to 314.16, ws2, ms3 cluster
if wpp breaks and tests as resistance, trade up to upper tl, d21ema, 224.0 cluster. option to is to take the chunk up to 200.0
if 200 wr2 breaks and tests as resistance, trade up to 161.8, wr3 mpp cluster.
Key Levels
Support
224.0 ms1 wr1 - 0.9772 - 0.9788
wpp - 0.9700, 0.9709
261.8 ms2, wm2, wtl - 0.9685 - 0.9674 - 0.9669
314.16, ms3 0.9537 - 0.9530 - 0.9573
Resistance *
224.0, ms1, wr1 d21 tl - 0.9772 - 0.9774
wpp - 0.9700, 0.9709
wr2, 200.0 - 0.9865 0.9774
161.8, mpp, wr3 - 0.9928 - 0.9937 - 0.9927
138.2 mr1,w21ema,50ma, parity level, ultra cluster - 1.0015 - 0.9998 - 1.0000 - 1.0003
-
09-18-2012, 02:51 AM #814
Hello everyone, I am new here and I am still in the process of mastering harmonics. I am curious what timeframe everyone else trades harmonics on primarily. I usually only trade 1 hour charts and up, but I see a lot of good patterns drawn with the Kor indicator that seem to work out well on 5, 15, and 30 minute charts. So what does everyone here do?
Thanks for any replies! Happy trading.
-
09-18-2012, 03:48 AM #815
I find harmonics on smaller timeframes working better (for me) than on the higher timeframes. Looks like most of my harmonic trades are lately on M15-H1 TFs, however the entry decision/timing is always from M1.
-
09-18-2012, 04:28 AM #816
Thanks Kor4x, do you often find that harmonics on the bigger TF's get invalidated? I have seen quite a bit of that myself recently.
-
09-18-2012, 04:58 AM #817
I think it's one of the mistakes of traders that they focus too much on the failure scenarios. I vote that it's better to measure if the number of successful patterns combined with your MM leaves you with each week on plus. Of course many pattern will fails, but ... who cares :-)
-
09-18-2012, 06:04 AM #818
guys, what is the most difficult for you in Harmonic Trading?
-
09-18-2012, 01:55 PM #819
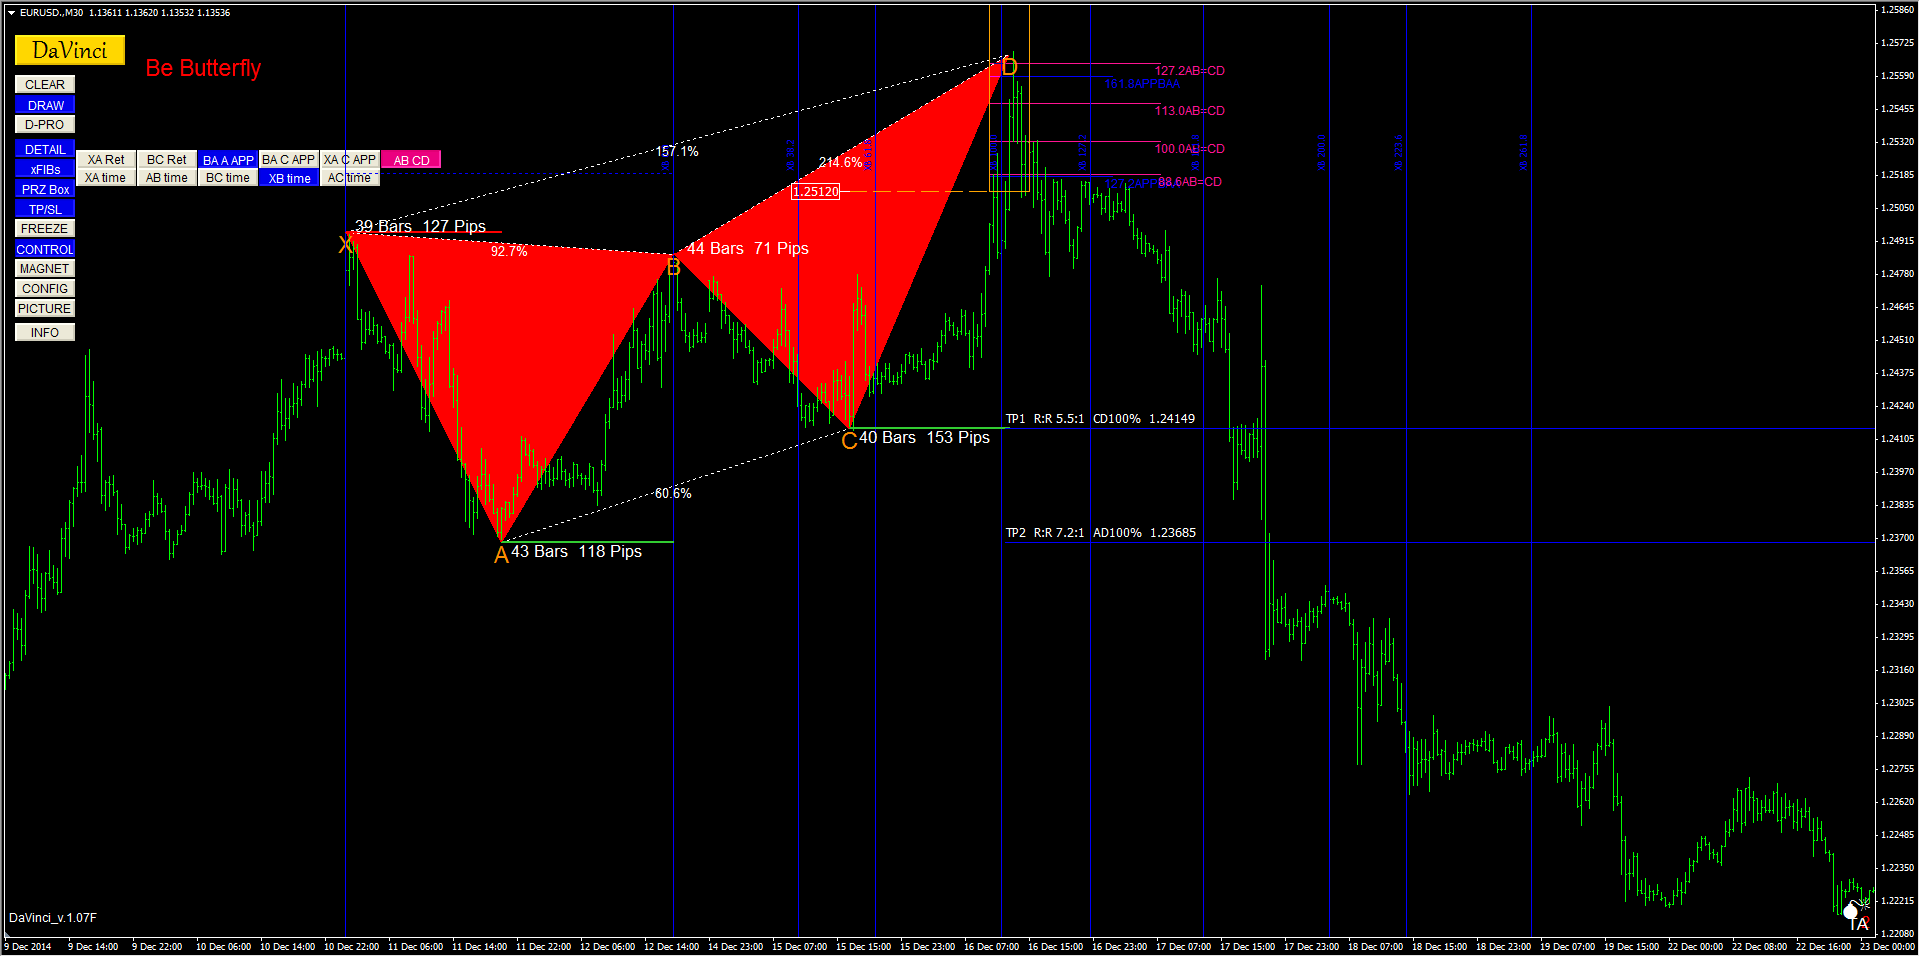
The most difficult thing for me in harmonic trading is deciding on where the true D might be. Virtually every pattern has more than one possible D points. I always try to pick the D point in an area where more than one fib levels converge together within 5 pips, using a top-down approach from Daily, H4, down to H1 or M30. For example, if a fib level of an extreme XA from Daily converges with a fib level of H4 and/or H1 and/or M30, as well as a fib level of CD (which is taken from BA and moved over to a C point) that would be the most likely D point for me because there should be more resistance built up in that particular area. Unfortunately, however, even with this approach, a D point sometimes falls on a different area and I get stopped out. This is proving difficult for me and I hesitate to make a large commitment on my pick on D.
-
09-18-2012, 03:52 PM #820
I think my biggest problem is letting the trade run once I get into a good one. I know if i could just do that, my R:R would allow me to lose several trades and still make money with just one winner. That is probably more trading psychology than anything, but is easier said than done for me. Any suggestions on targets?
Tags for this Thread
Posting Permissions
- You may not post new threads
- You may not post replies
- You may not post attachments
- You may not edit your posts
-
Forum Rules