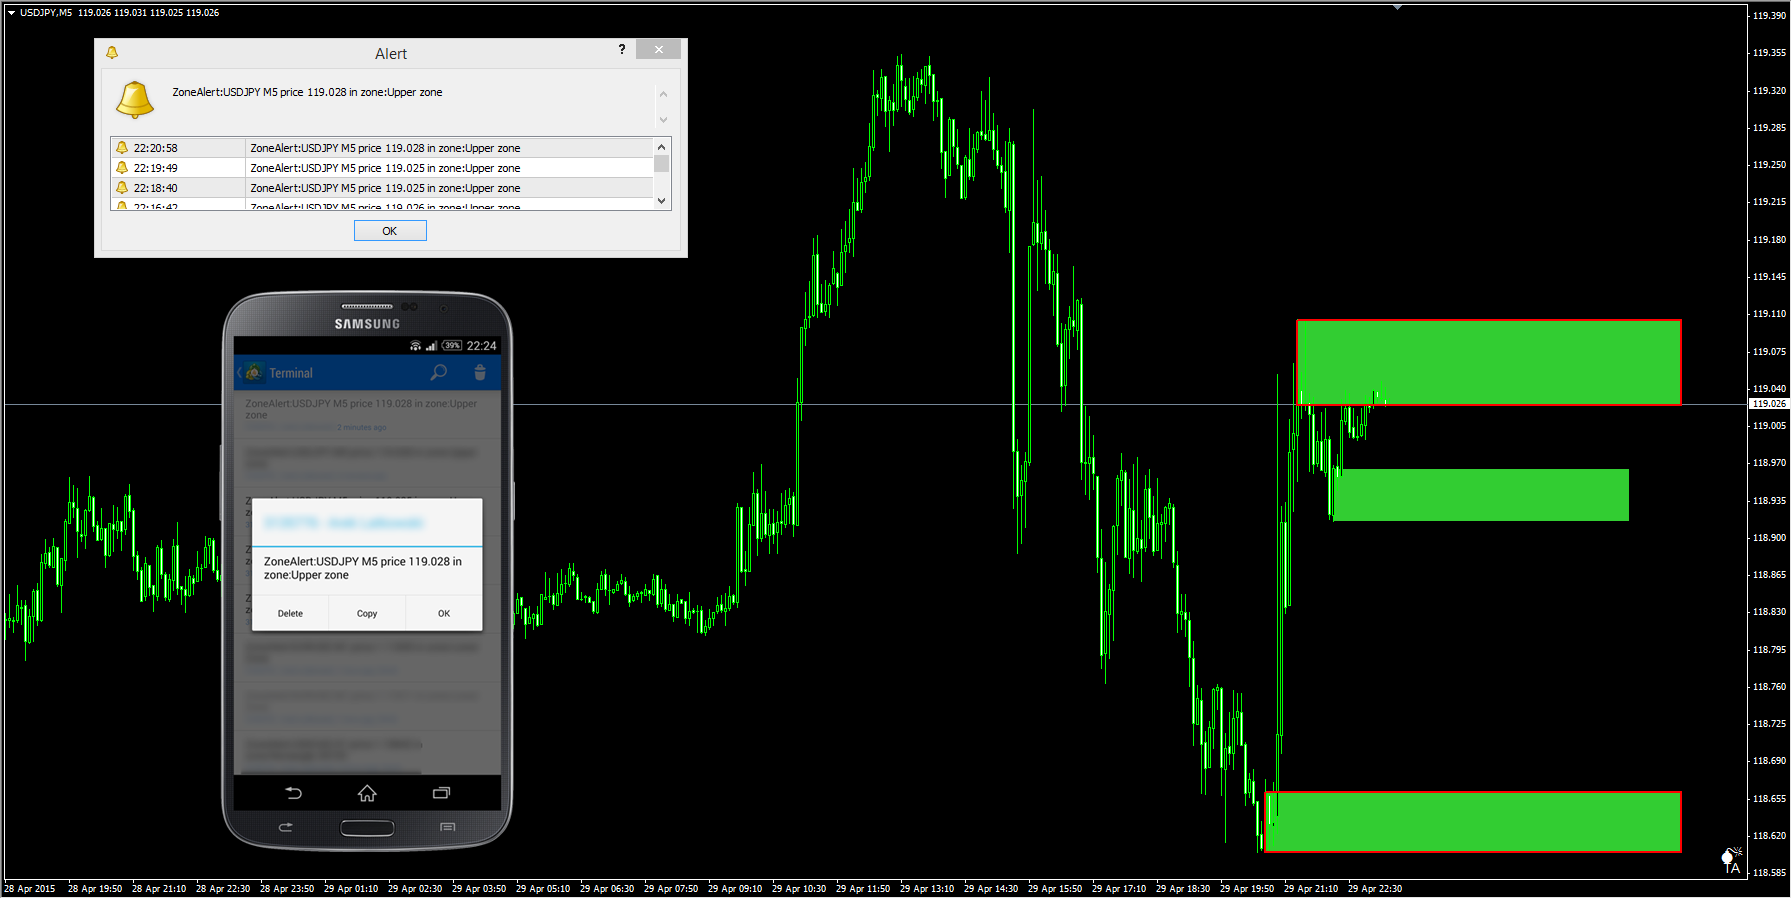
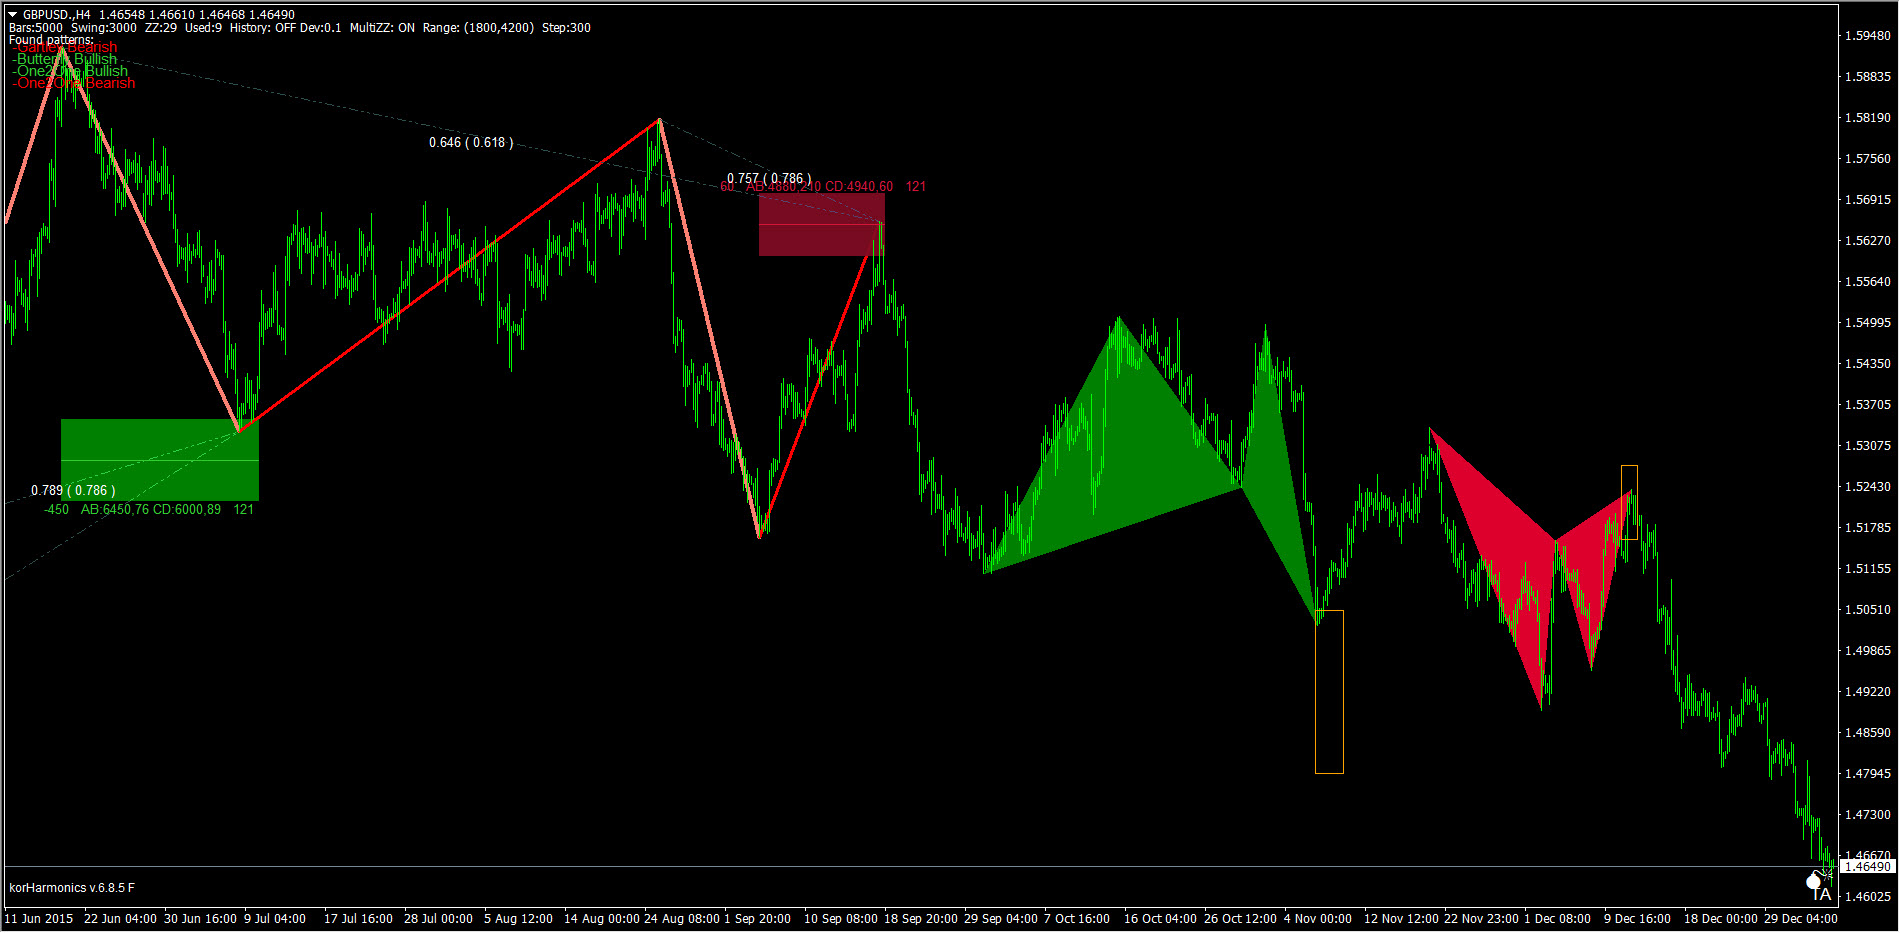
for me it looks like we have an emerging Short oportunity on EURJPY and Long on USDCAD.
I am glad to help for development of knowledge and practice before / instead of losing money!
Just because there was a question on other places about installation and using multi TF capabilty, please see what I came up with as answer if anybody would run into the same problem,
I hope all installation was OK, and single TF works...
You will know all is OK, when you set the Simple Forex Tester as an EA in the MT4 strategy tester and start the test by clicking START, before the chart starts running, a small window opens telling, the SFXT is connected...after that point a new tab on the bottom in windows will be your trade control for speed/pause/entries...
http://gyazo.com/bf95e857ebec04abc7e04d782a48704f
When chart simply starts to run without these things happening, your installation was not correct.
If it does not, then check
- Tools/Option/Server menu has DDE server enabled
- Check file location is correct in the user/...long names.../long alphanumericals /MQL4 directory (whatever opens when you go to MT4 file/Open Data Folder option)
If you are up and running with the installation, and set up the SimpleFXTester EA in your Strategy tester to run backtesting with it:
Gyazo - 773dcf3842bda4412a62f76acfe51fc8.png
in the MT4 Strategy tester function before you START running the Strategy Tester, you need to change the "Expert Properties" and set there "Use Multi Timeframe" to "true"
Gyazo - 049619cdeb990324c596e3955131b554.png
(Note: there is a custom TF available as well, when you set it true, you can test unconventional TFs as well, the same way as the standard MT4 TFs)
Then can start....
Next after starting, pause the Strat tester, and go to MT4 file menu
- select there "Open Offline chart"
Gyazo - 0653b2992e975760e8ca7c633ef0a32e.png
Make sure you open the offline chart of the pair you are testing...e.g.: if it is EURAUD you started to test..go to EURAUD offline
Note, there will be the normal EURAUD,TF kinda names, do not pick those!
Pick the ones having a name like EURAUD_tsd,TF of the timeframe(s) you want..... You can have any TF whichever has _tsd in its name.
Tile your windows as you like and see them ticking at the same time .
- If you want to have more TFs together you need to open an other offline chart as above.
- you can apply your indis to each of these opened charts as normally in MT4 (some might not work if you use unconventional TF)
- Would you need more history to test, will need to go to MT4 menu Tools/ History center and there download data for the pair and required timeframes, you will have a lot of years for testing.
One more note, after you started your tester and happy with the speed setting, and it is running OK, you might minimize the tester window by double clicking on the left stripe of it below the X) so you can tile your charts on the full screen...same way you can maximize the tester window if you want to check history by trade and the performance graph of yours.
http://gyazo.com/85bd683d0cf94c86a4a91369e2fa1660
http://gyazo.com/ace9c566d79dbe0993fcea68f6956c07
Good luck! Enjoy it, it is really great.
Last edited by lobogabor; 09-17-2014 at 03:23 AM.
for me it looks like we have an emerging Short oportunity on EURJPY and Long on USDCAD.
Harmonics Tube - daily trading setups based on harmonic patterns
Forex Harmonic Trading - Harmonic trading practical tips, tricks and hints
AMPmonitor - harmonic and price patterns recognition Scanner that I use
TradingArsenal Quiz project - best edu material regarding the Harmonic Patterns Trading
we are at a decision point on AUDUSD and USDCAD ... worth looking
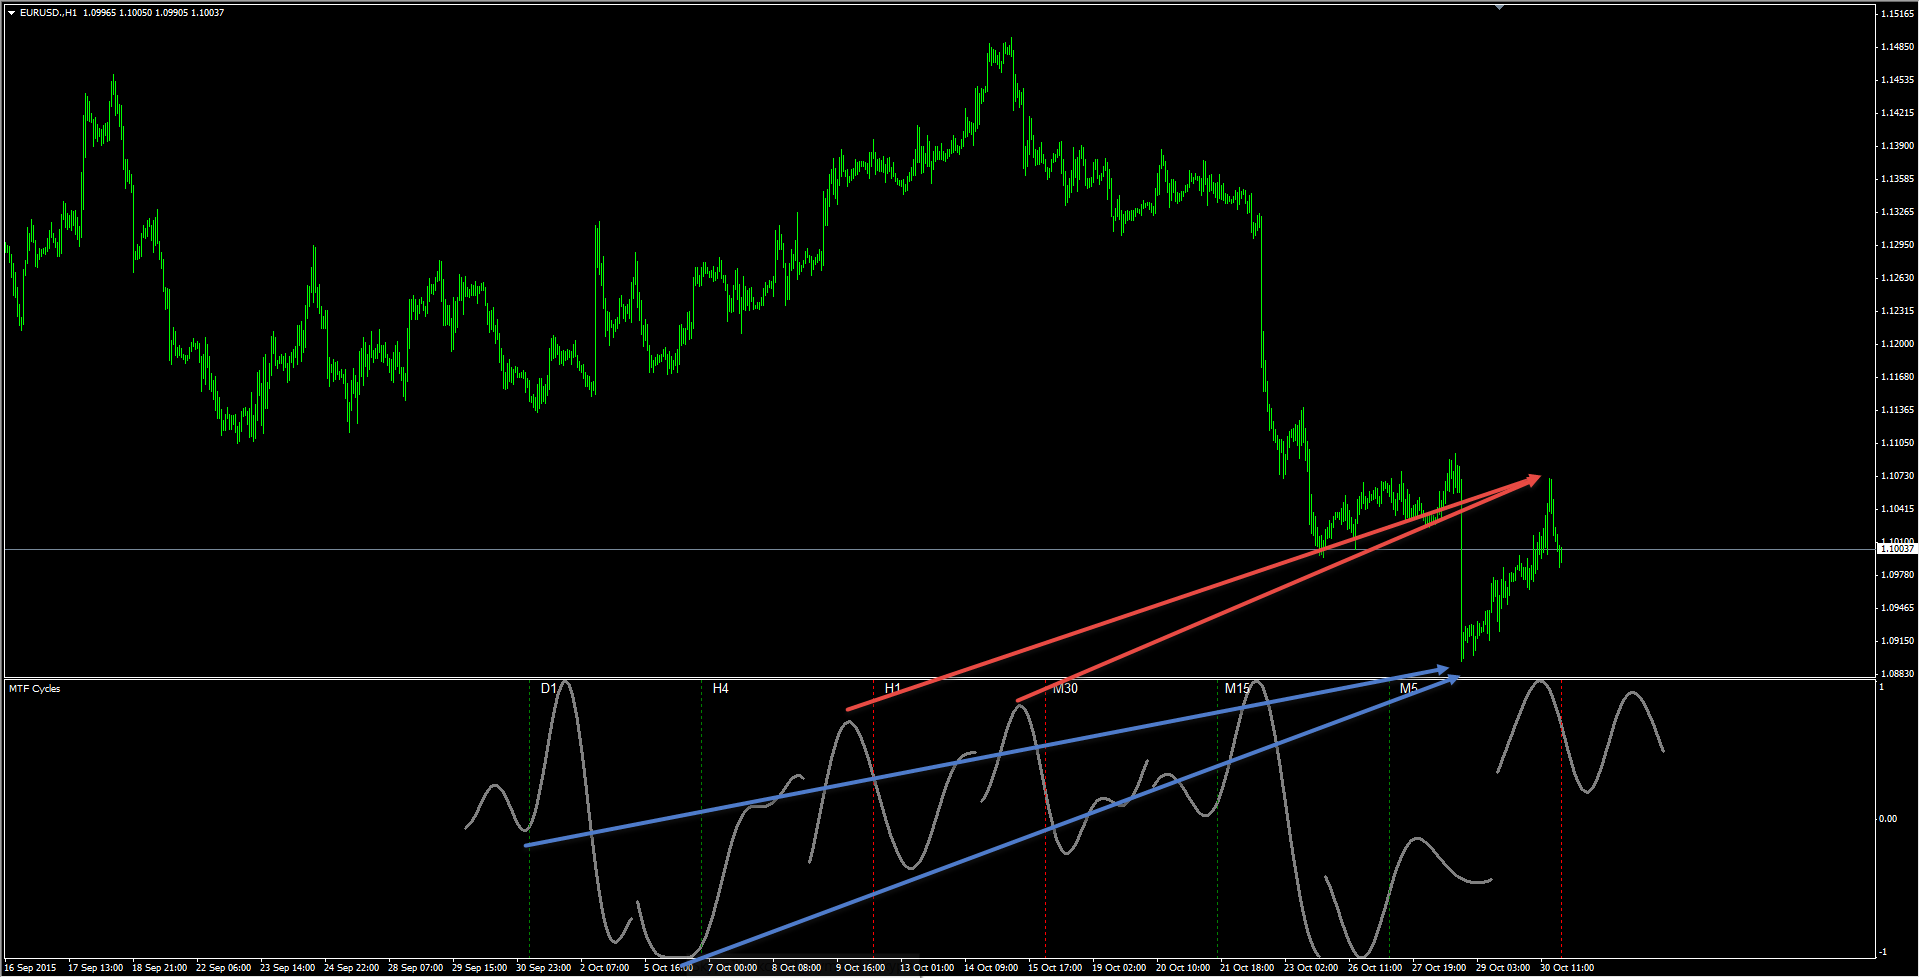
will the bullish diagonal work on AUDUSD?
Would be nice if it did, this pair has been in big slide lately.
AUDUSD, if takes now lows may be intersting for Longs again.
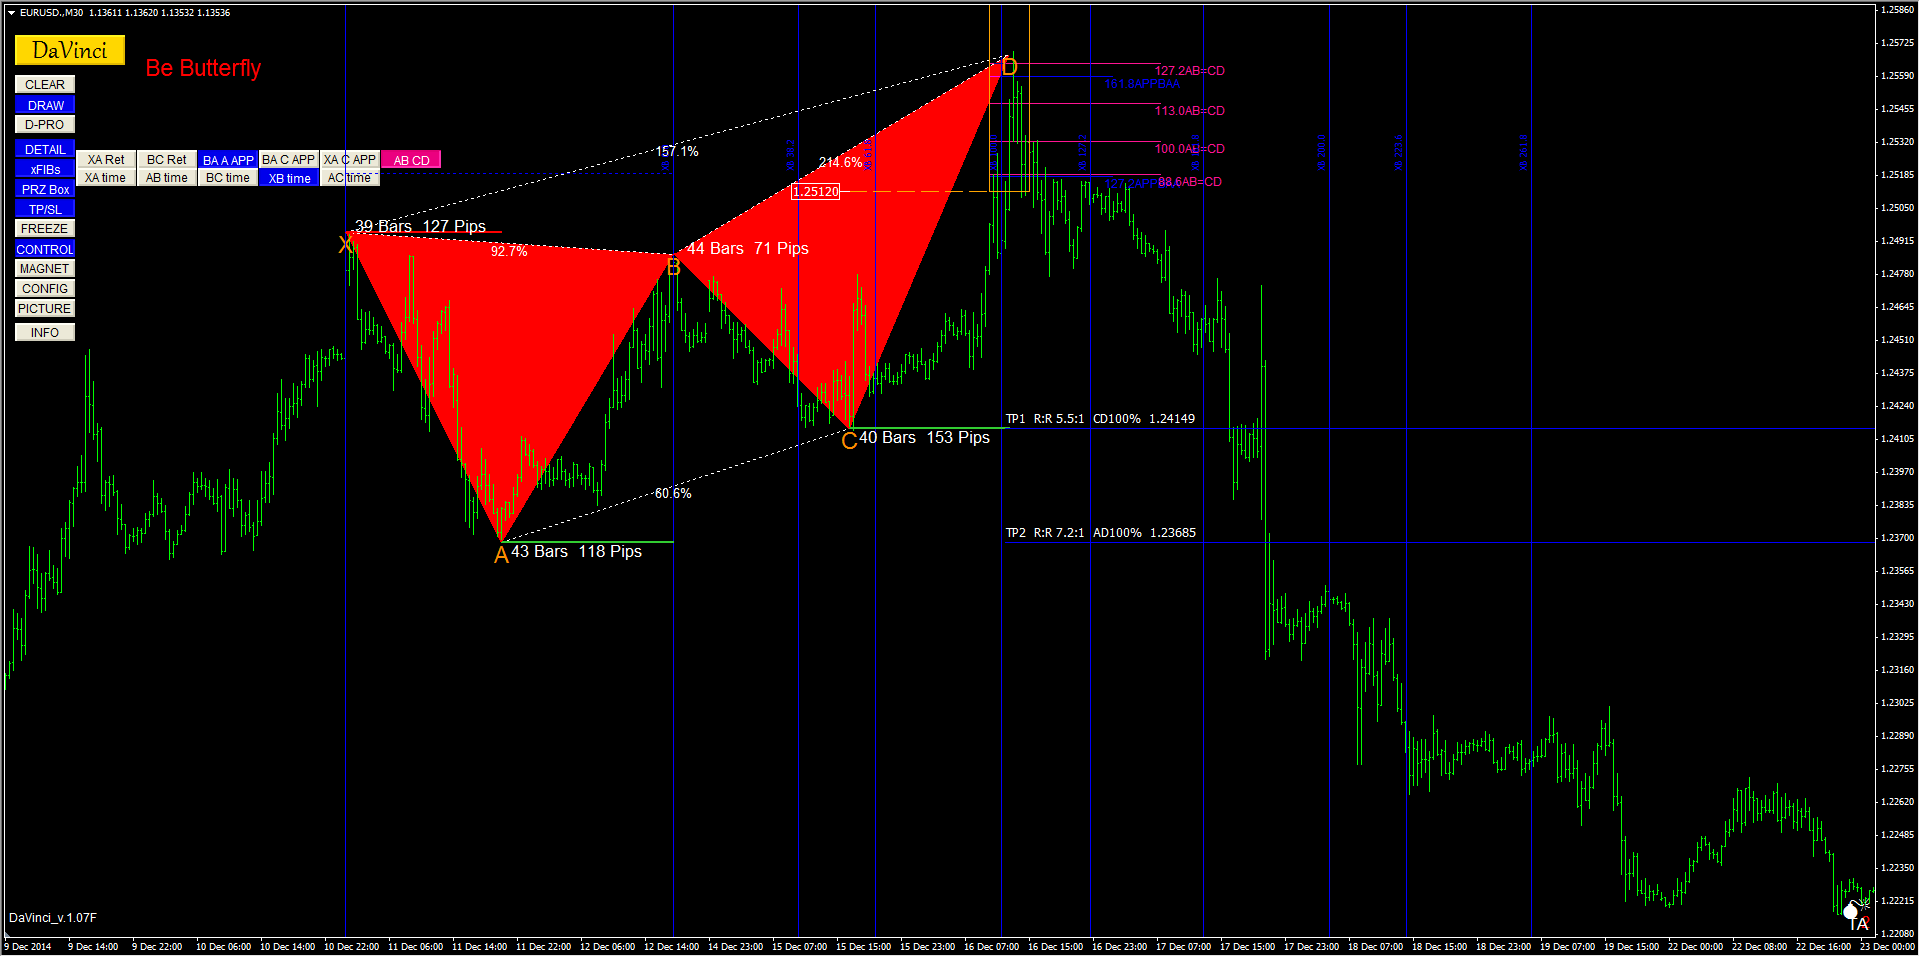
Harmonics Tube: Butterfly pattern emerges on Forex USDCHF
looking for a Long on EURUSD and EURJPY, so this would be inline with the USDCHF, lets see![]()
EJ long @138.50
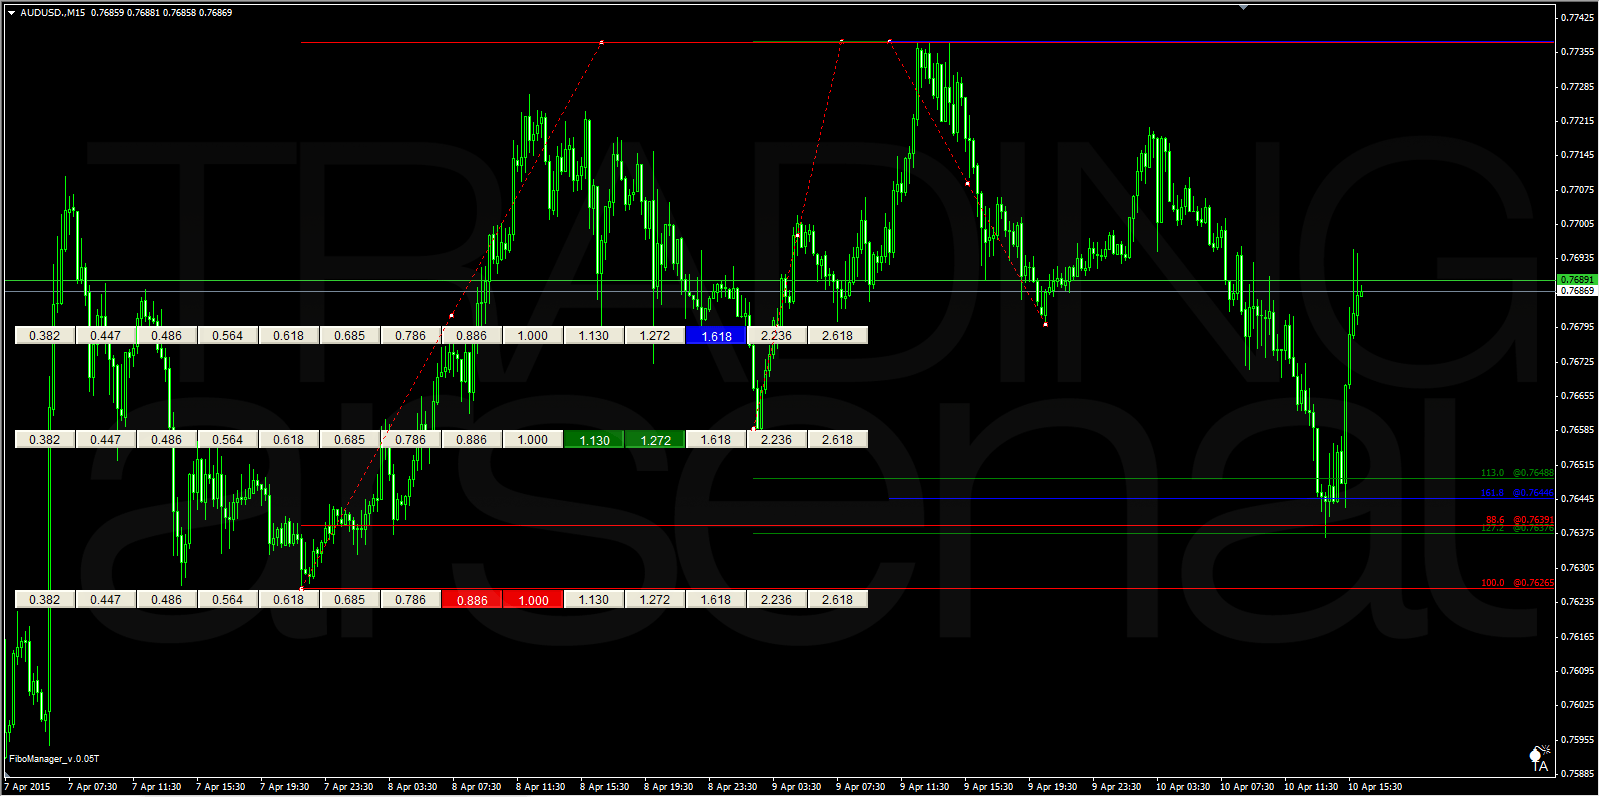
AudUsd looks nice...does anybody have any info about the kordynamicfibonacci indicator on the right of the graph?
Chart AUDUSD, M15, 2014.09.30 01:20 UTC, Alpari (UK) Ltd., MetaTrader 4, Demo - MetaTrader Trading Platform Screenshots
Seems like a relatively old tool gone out of users head... I myself just undusted it today, wana give it another try, tried years ago.
I do find some blogs discussing it shortly in the past, but no real conclusion about usage..
some people refer to it as setting up the right parameters it is a miracle..all they forgot in those old times, what they referred to as "right parameters"
I will appreciate if someone can point me into the right direction to the "right parameters"
definitely capable to show confluences
Which of course can be drawn manually on multiple timeframes (or zooming out one graph) as well... I do know that.
Similar to autofibo, but much more advanced in the sence of taking into consideration different size ZigZags...i.e. like different TFs (based on my limited knowledge about zigzags and TFs).
Also I find interesting, those confluences matching the Sup/Dem or Res/Sup levels..
Really looks good again, after years not using it.
Maybe after practicing enough double bottom and double top patterns preferably with divergence starting with the oscillator in oversold/overbought status, start practicing the 4 point harmonic patterns is the next simple step to progress? Just 2 examples of current days:
Chart #CLX4, H1, 2014.10.02 00:56 UTC, FxPro Financial Services Ltd, MetaTrader 4, Demo - MetaTrader Trading Platform Screenshots
and
Chart #NGX4, H4, 2014.10.02 00:57 UTC, FxPro Financial Services Ltd, MetaTrader 4, Demo - MetaTrader Trading Platform Screenshots
amazing, isn't it? there are 2 problems coming to us:
- overshoot to take us out of our beautiful trade
- the 100% ABCD level will be missed by just a few pips
familiar?
Any suggestion to get by these?
Last edited by lobogabor; 10-02-2014 at 03:10 AM.