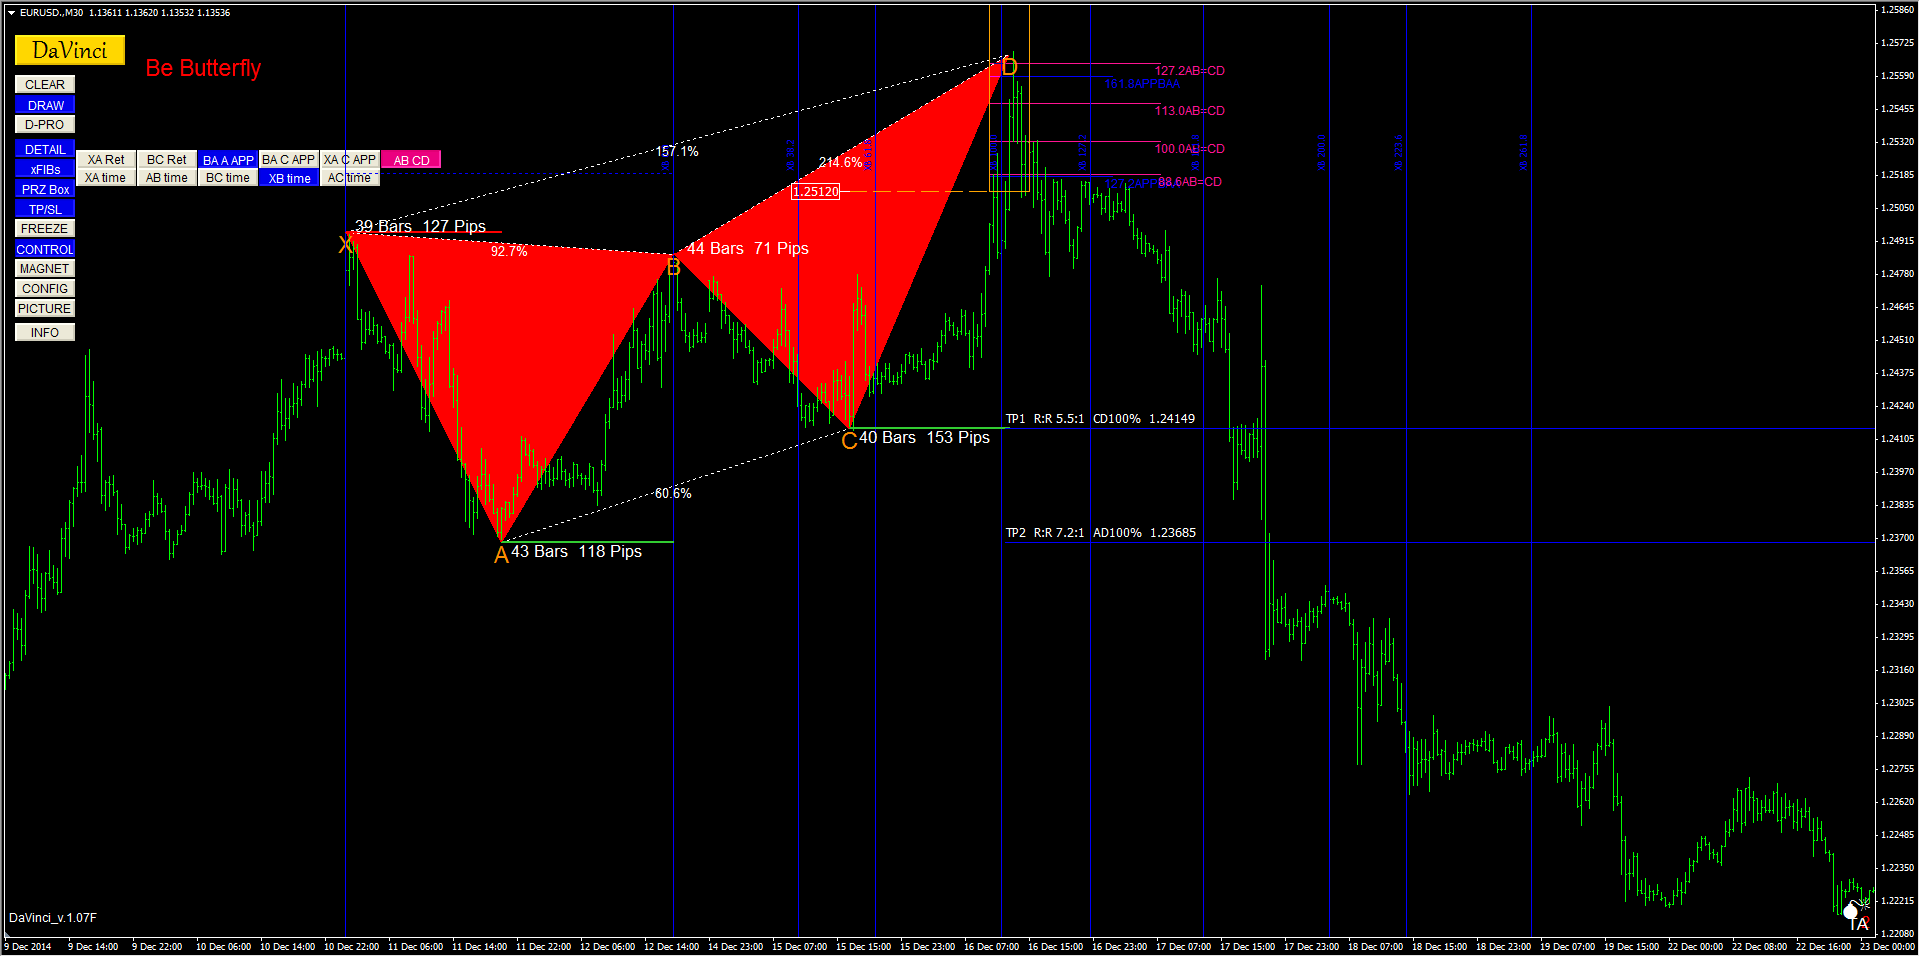
Butterfly pattern fits perfectly into Elliott Wave Theory.
Butterfly pattern can be located on wave 4 and 5. CD swing would be labeled as Elliott's impulse wave5. Note that in such case, both harmonic and Elliott traders try to catch the end of the trend.
see the diagram:
Another location is the butterfly patter at the end of corrective move (Elliott wave BC). See the diagrams presenting this type of butterfly pattern in bullish and bearish scenario:
For more info about Butterfly pattern and the confirmation methods see -> Butterfly pattern - table of content
Last edited by kor4x; 08-20-2012 at 01:23 PM.
It was explained above about the 2 best locations for the harmonic butterfly pattern.
To remind.
First, is at the end of impulse swing ->
Second, is at the end of corrective move ->
Consider ignoring all the other butterflies. Note that harmonic pattern recognition indicators rarely analyse the location of the pattern, they often present butterfly pattern (meeting the Fibonacci price relations) in the wrong location. Now you will not be surprised why so many of them fail.![]()
Last edited by kor4x; 02-09-2013 at 01:49 PM.
hi kor4x
1. Can the bfly (or crab) XABCD keep all the impulse or correction swing (X in the beginning of the swing and D in the end of the swing) ? or it (X) has to be near to the end of the swing and D at the end ?
2. what are the harmonics waves rules in range configuration? can we exceptionnaly trade all the patterns ignoring ther position on the swing?
Last edited by winner22; 03-06-2013 at 08:48 AM.
hi
may i have some answer ? i'll enjoy it a lot ;-) thxs
@1,please give a picture of what you are asking. I do not understand the question
@2. Probably you can trade the patterns in any location, but in my approach it's not correct and I prefer to select the proper location patterns only.
There are so many patterns around that we can pick up the best ones, right?
Note however that there can be different criterias what person calls proper chart location. My way (and the people i trade with), is to combine harmonic patterns with Elliott Wave theory to choose the best locations. Check the Gartley or Butterfly Forum sections for details on it. It's clearly explained and presented on the slides. Hopefully clearly![]()
1.
hmmmm i know that my bflyss are awful but it's just for the example ;-)
2. i know your position about patterns position and elliot waves and it's mine too. my question is only on range configuration because it's difficult to define waves in range config and when we approach a supply or demand zone (up or down of the range) i wondered if any figure could help or no (just specific to reversal)
@1. only the ones you marked as OK are OK for me, although if you see our Elliott Wave counts for butterfly patterns, it s a bit different. Ignoring details, it's OK.
the ones you put as the Question, I do ignore. If person considers only price relations, there are many, many patterns appearing each day, the point is to select the most tempting, and the ones you marked as "Question" are not tempting for me. Anyway, decided by yourself, they still may be tempting and worth the resk - for you.
@2. analyse historic patterns and pick up what you see working. No shortcuts here, sorry.